Predictive Maintenance
Provides operators with a real-time view into asset risk and proactively notifies about abnormal equipment conditions enabling operators to maintain high level of asset availability and optimal equipment efficiency.
Types of Units
- Turbines
- Compressors
- Fans
- Engines
- Pumps
- Furnaces
- Heat Recovery Steam Generators (HRSGs)
- Boilers
- Generators
- Electrical Motors
- Transformers
Diagnostics Concept
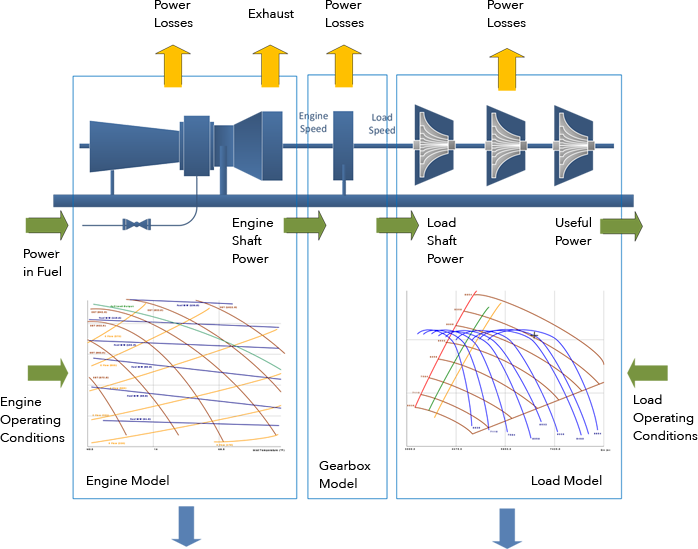
Modeling
- Construct load and engine models based on manufacturer-provided performance characteristics.
Monitoring
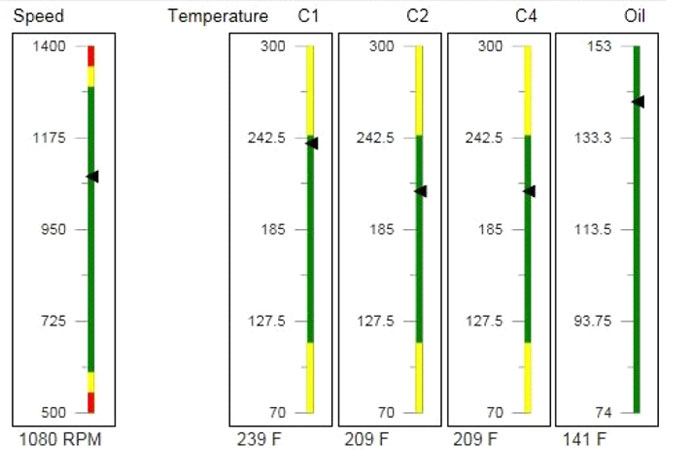
- Real Time data collection and displaying the operating point relative to the operating envelope and limiting lines.
Auto Tuning
- Continuously auto-tune the process model and adjust model coefficients.
Trend Analysis
- Calculate unit key performance indicators (KPIs) and conduct a trend analysis to monitor equipment degradation. Analyze KPIs with Lean Six Sigma.
Notifications
- Provide notifications for declining machine efficiency and abnormal events
- Monitor asset health based on trend analysis, individual units KPIs, health scores, and maintenance projections./
- Sustain optimal performance, balance costs with lost revenue & energy costs
Modeling

KPIs
- Gas Generator Thermal Efficiency
- Power Turbine Thermal Efficiency
- Compressor Performance Deviation
- Complete Gas Turbine Engine Thermal Efficiency
- Inlet Filter Pressure Drop
- Emission Level Deviation
- Vibration Level Deviation
Gas Turbine KPIs:
- Compressor Polytrophic Efficiency
- Compressor Performance Deviation
- Vibration Level Deviation
- Oil temp
Axial / Centrifugal:

Trend Analysis
The principal idea of the Trend Analysis algorithms is that efficiency decline can be measured and predicted over time. The goal is to evaluate process Key Performance Indicators variation against set baselines and to provide the operator with proactive maintenance recommendations. To represent the process efficiency metric decline, OptiRamp uses least squares regression to estimate curve parameters and generate the line of best fit to forecast future performance. It tracks the deviation of KPIs from healthy conditions and alarming if the deviation exceeds a threshold.
Web Visualization


